

Assignment Prompt
Microphone Study - Project Overview
In this project you will be using Adobe Audition to record and analyze microphones performance. You will learn how to measure the Signal to Noise Ratio (SNR) of the microphone. The higher the SNR, in dB, the less noisy the microphone performance will be. Every microphone type/model has a distinct frequency response which affects the timbre of the microphone recordings. The frequency response is typically obtained through impulse response measurements which is beyond the scope of this course. A rough sense of frequency response of the microphones will be seen by recordings a noise signal.
Project Directions
Obtain two microphones; one dynamic mic and one condenser mic.
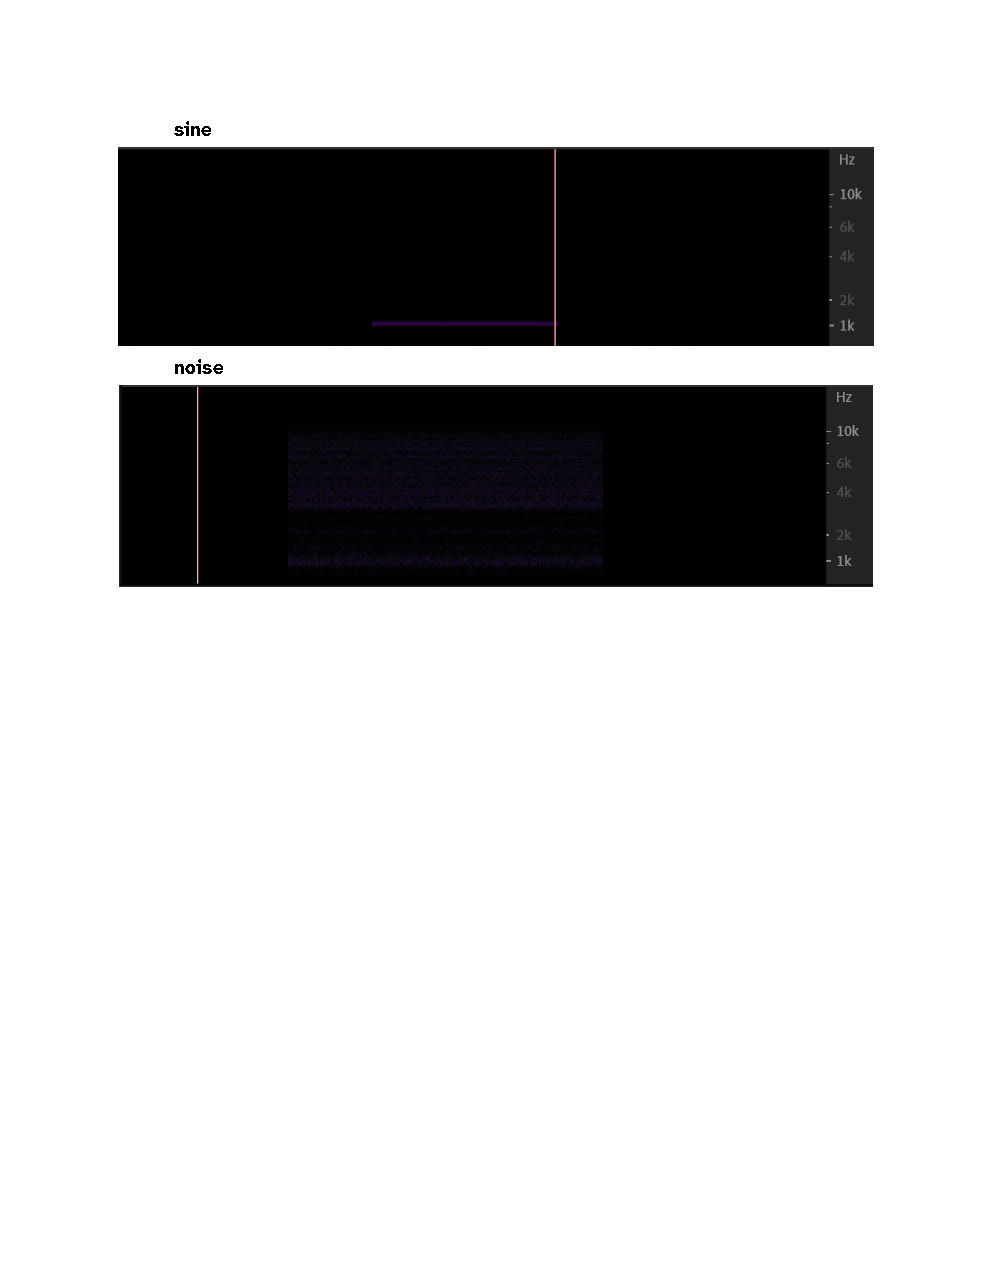
Use Adobe Audition to generate:
1: 1kHz Tone of about 10 seconds in length
2: (White) Noise of about 30 seconds in length
Use Adobe Audition to make six recordings:
1: Anechoic (silence) recording with both microphones. For this recording find the quietest room available to you. Could be a closet or practice room. Be careful that there are no fans, heaters or air conditioners running that will be picked up by the mics. Record for one minute.
2. 1kHz tone recording. For this recording you will need a loudspeaker to play a 1kHz tone. Use an SP Lmeter (or an SPL meter app) and set the playback level of the 1kHz tone to 94dB SPL (A-Weighted).Trim the recording such that there are 15 seconds of silence before the tone and 15 seconds of silenceafter the tone.
3. (White) Noise recording. Use a loudspeaker to play the (White) Noise signal. You can use the sameplayback level used in the 1kHz Tone playback. Trim the recording such that there are 5 seconds ofsilence before the tone and 5 seconds of silence after the tone.
SNR Measurement:
1. Measure the RMS level of the anechoic (silence) recording.
2. Measure the RMS level of the 1kHz tone recording. Make sure to only measure the tone and not thesilence before/after the tone.
3. SNR = level of tone - level of silence
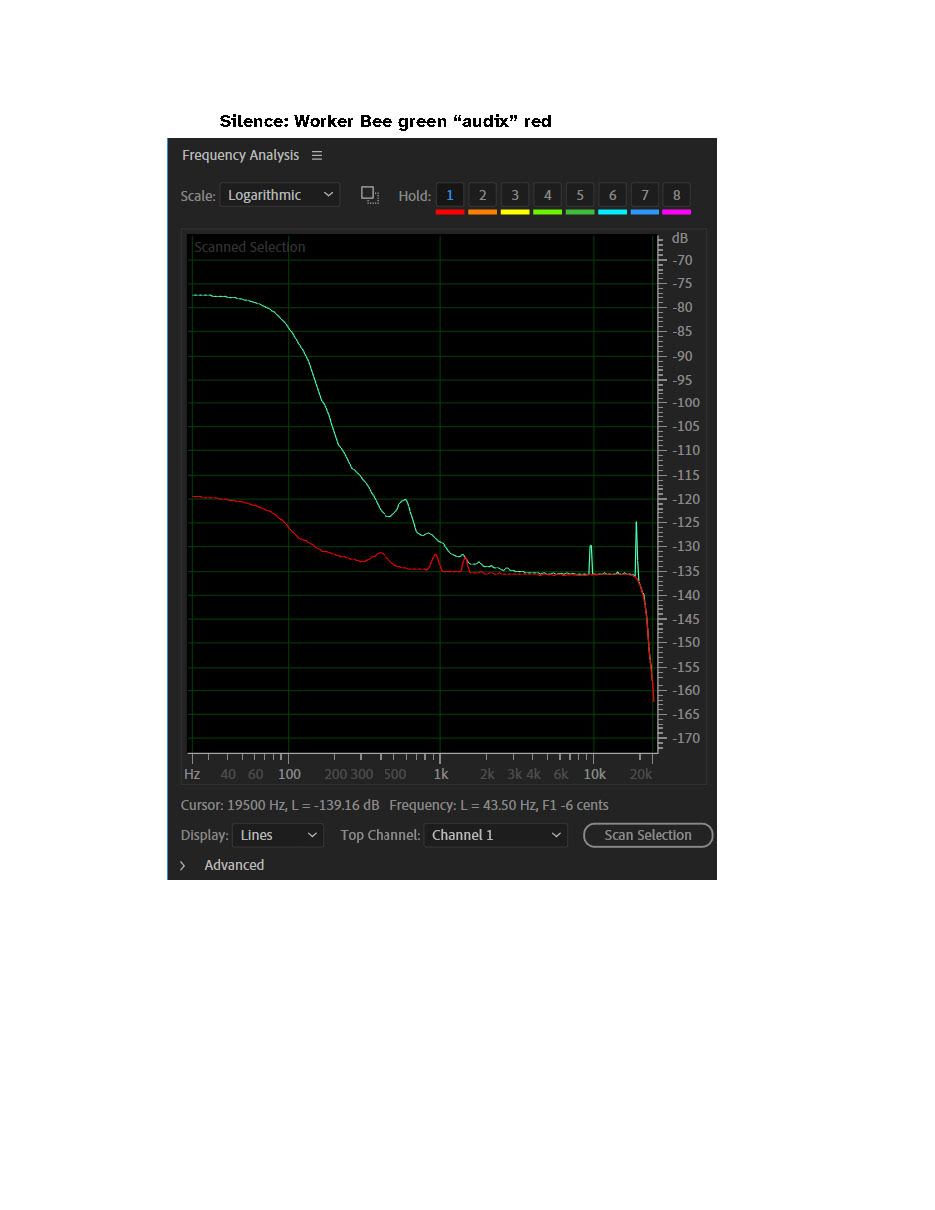
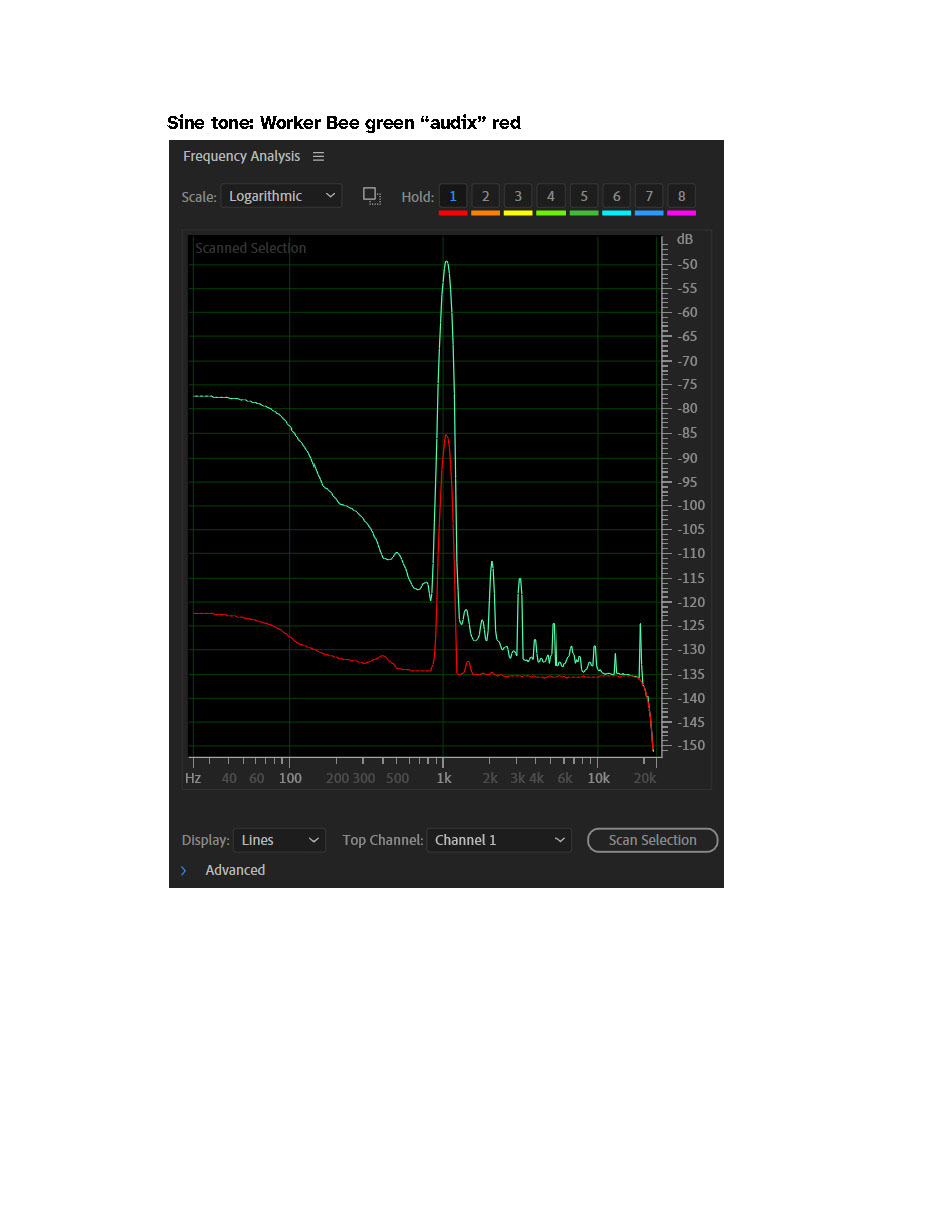
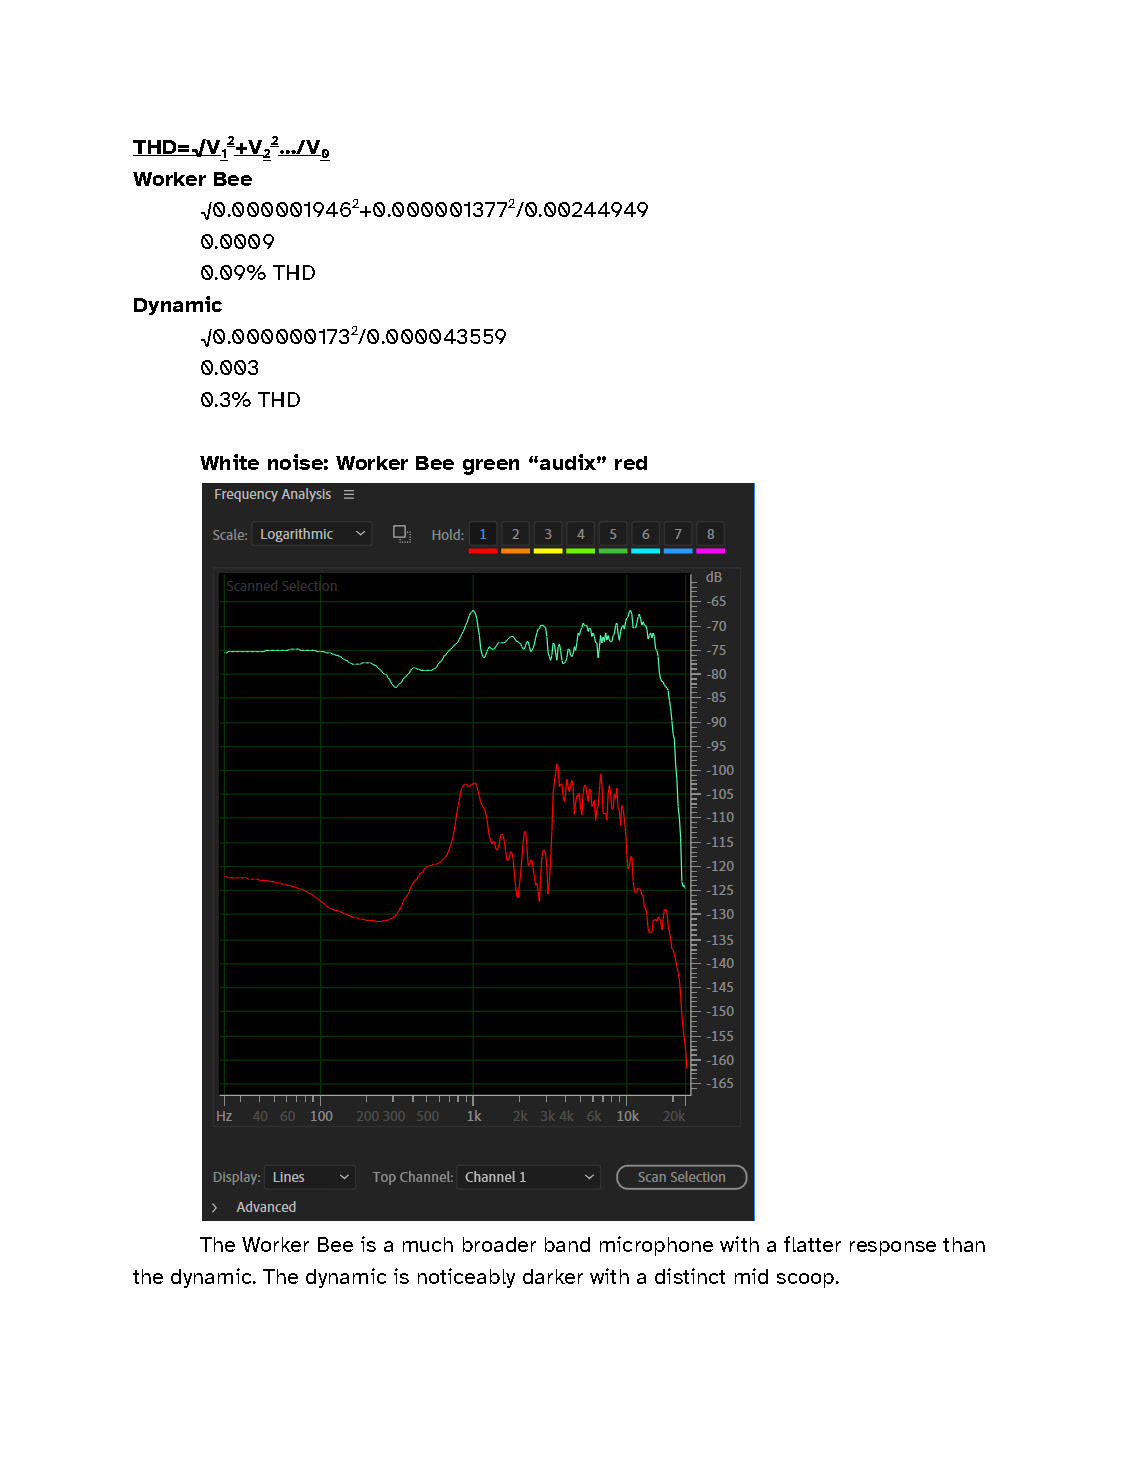
Create three Frequency Analysis Plots. One plot for each recording type [1. Anechoic (silence), 2. 1kHzTone and 3. (White) Noise recordings]. Show and label both microphones on each plot.
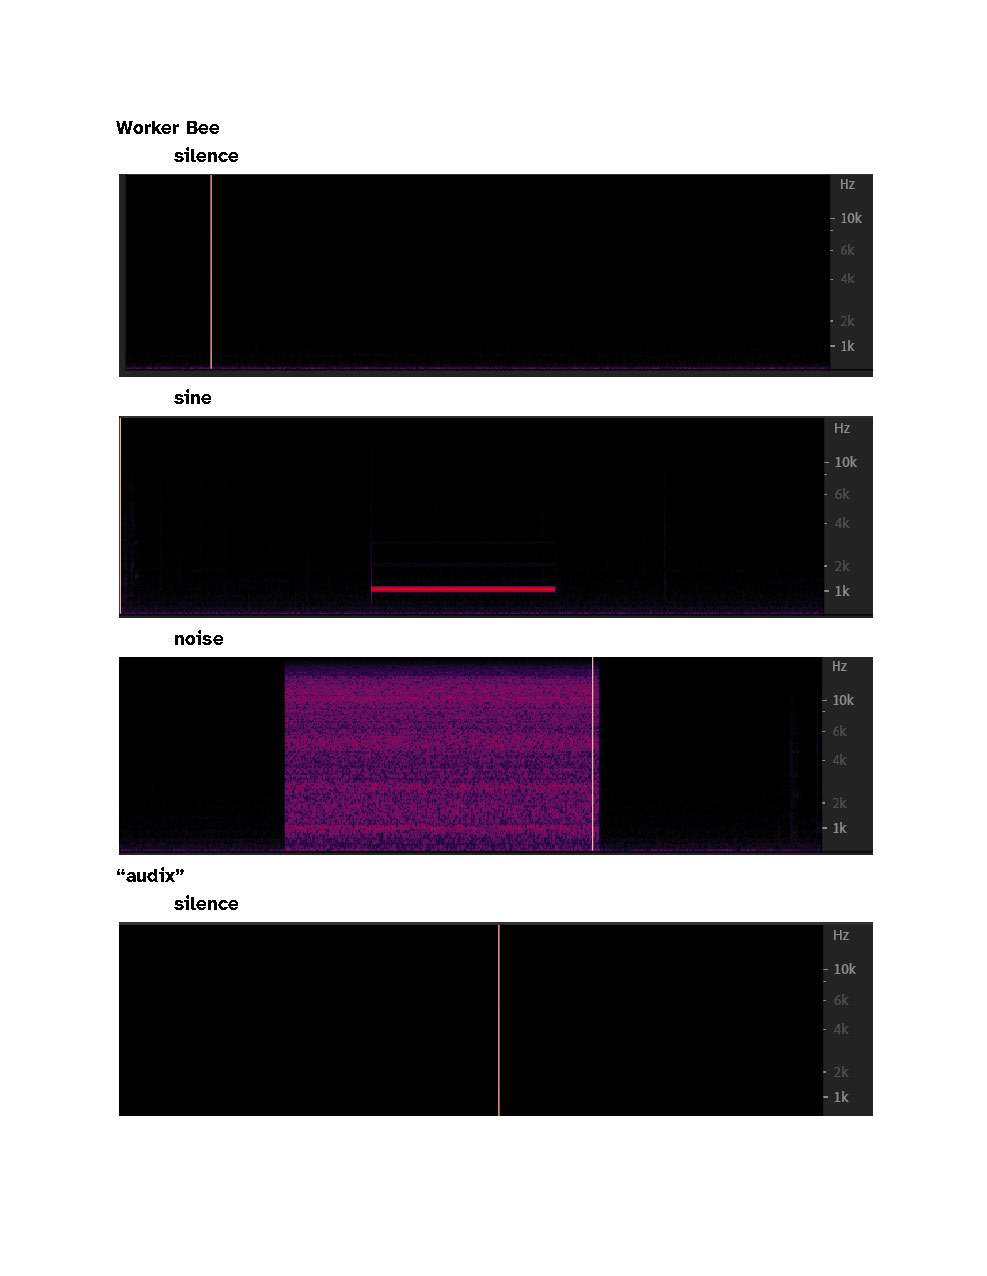
Show the spectrum of all recordings.
Deliverables (What to Submit)
1. Microphone recordings (6 total):Dynamic microphone anechoic (silence) recording
Condenser microphone anechoic (silence) recording
Dynamic microphone 1kHz tone recording
Condenser microphone 1kHz tone recording
Dynamic microphone (White) Noise recording
Condenser microphone (White) Noise Recording
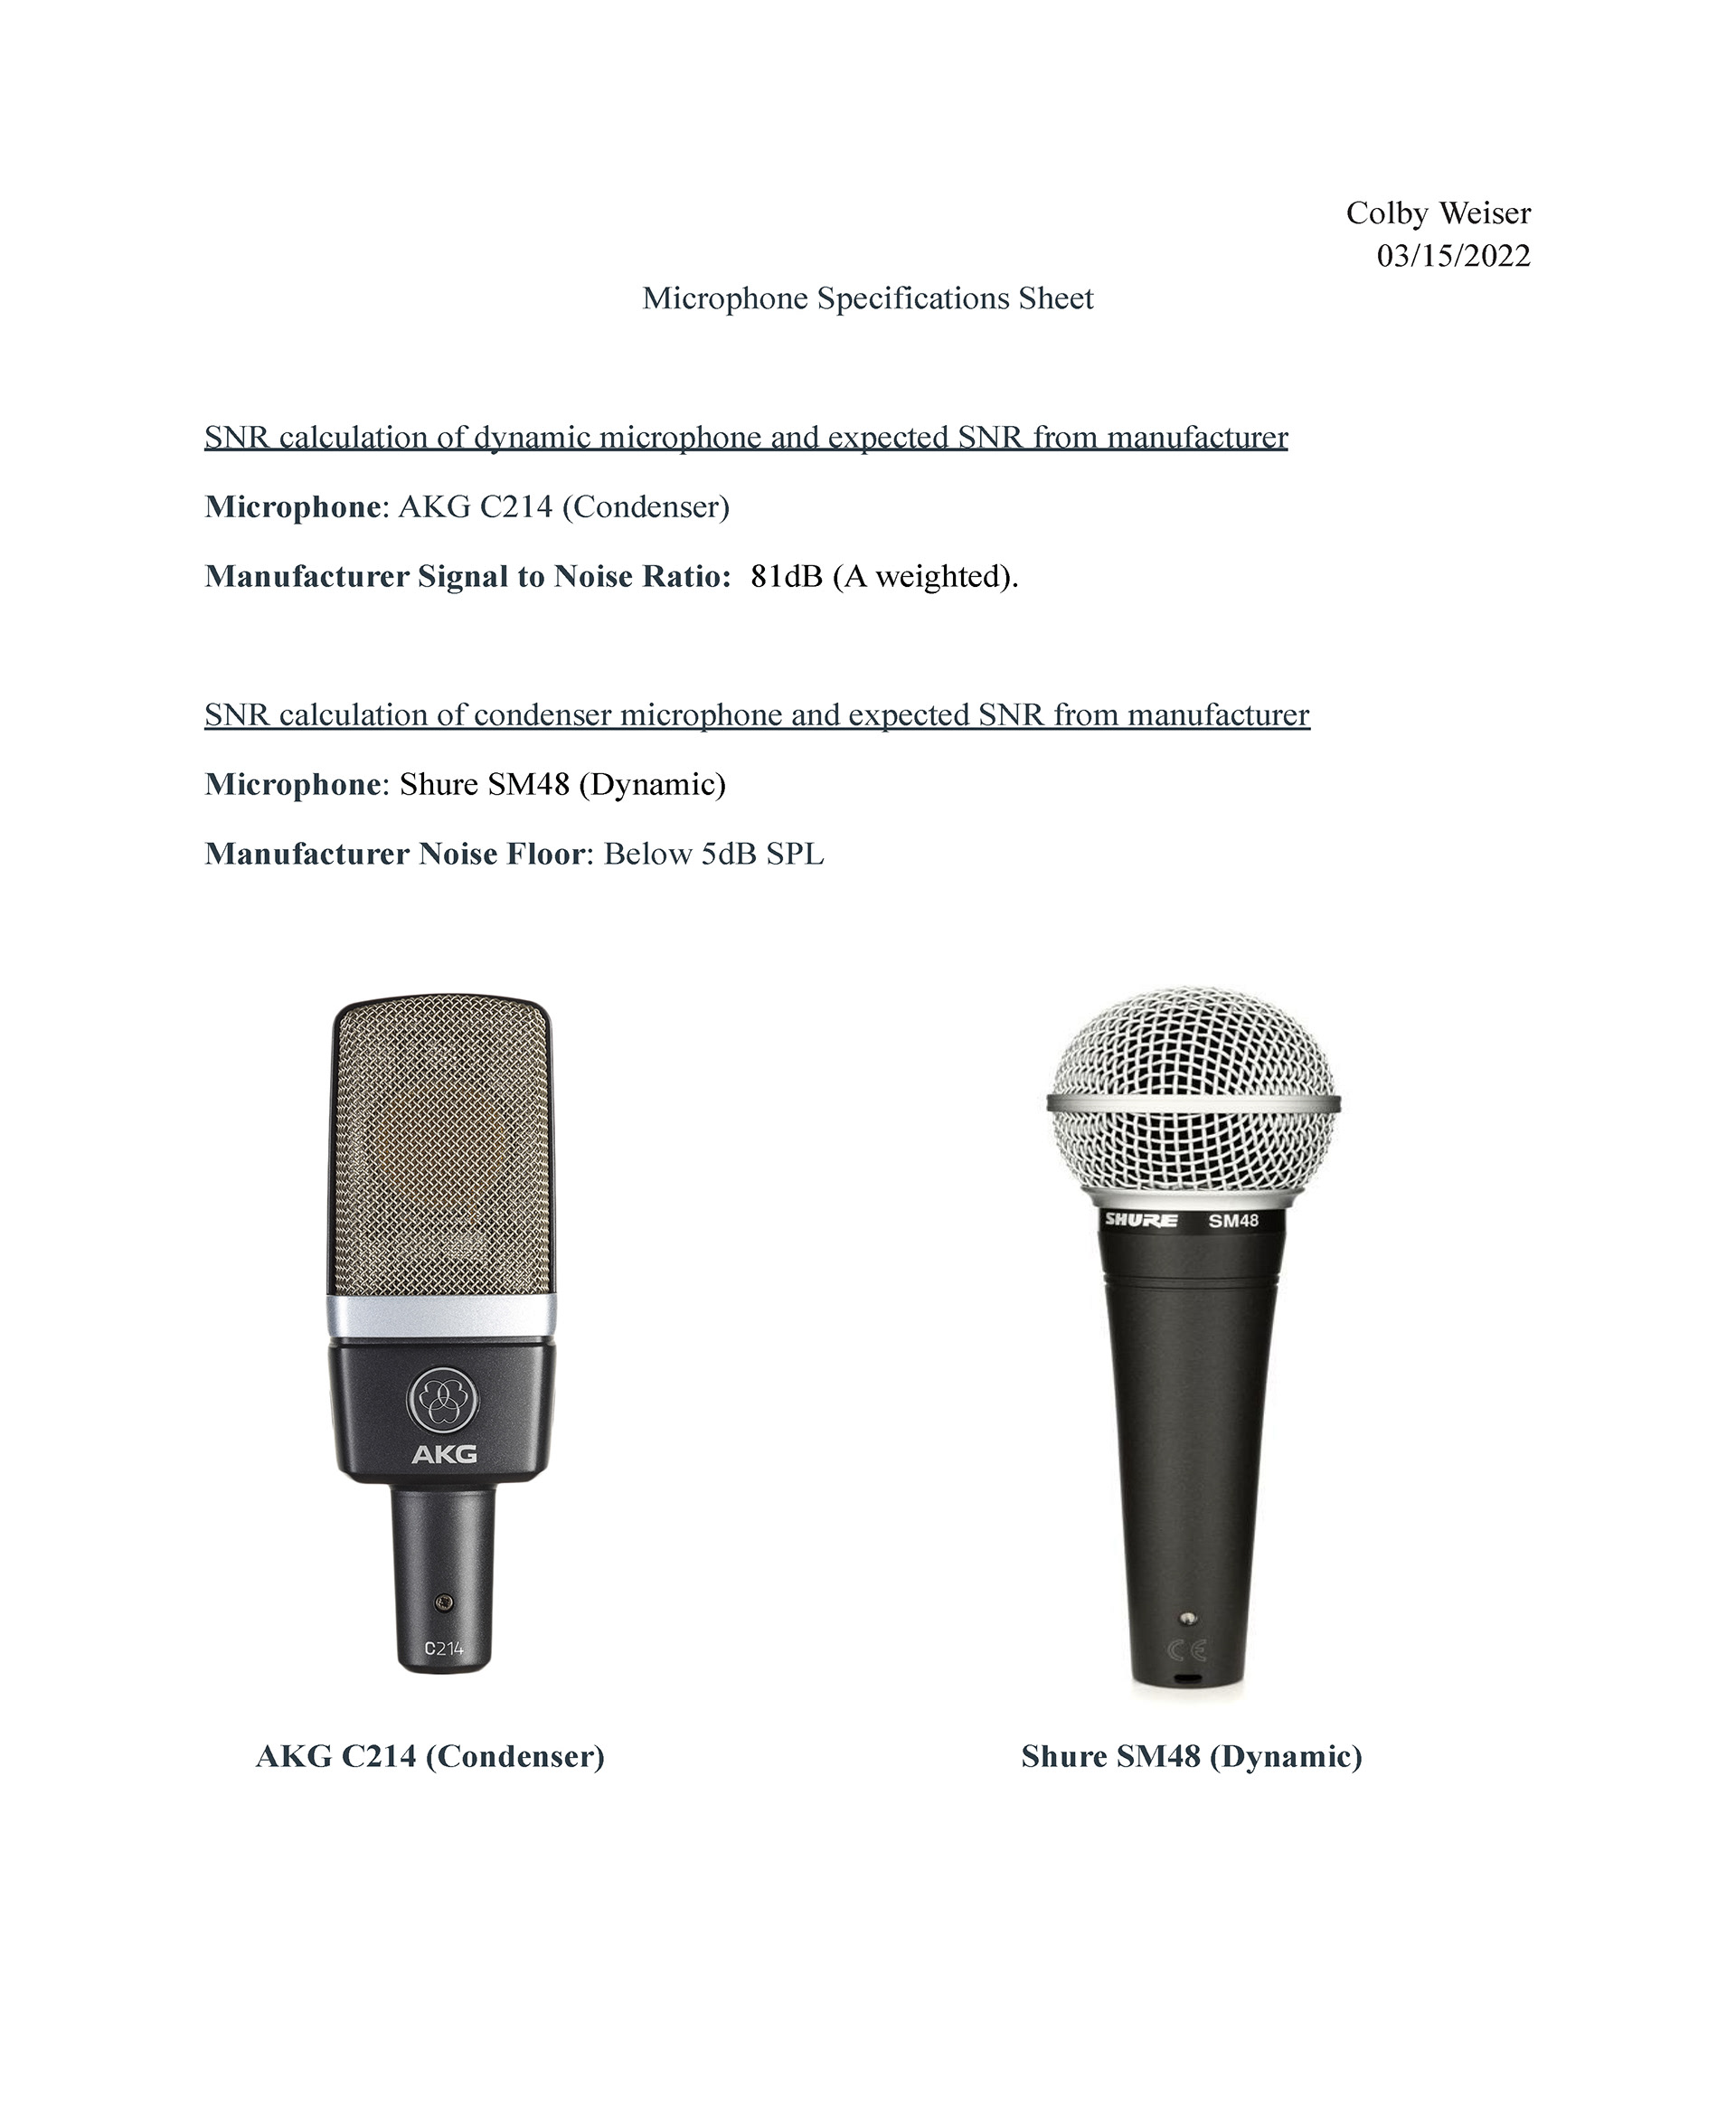
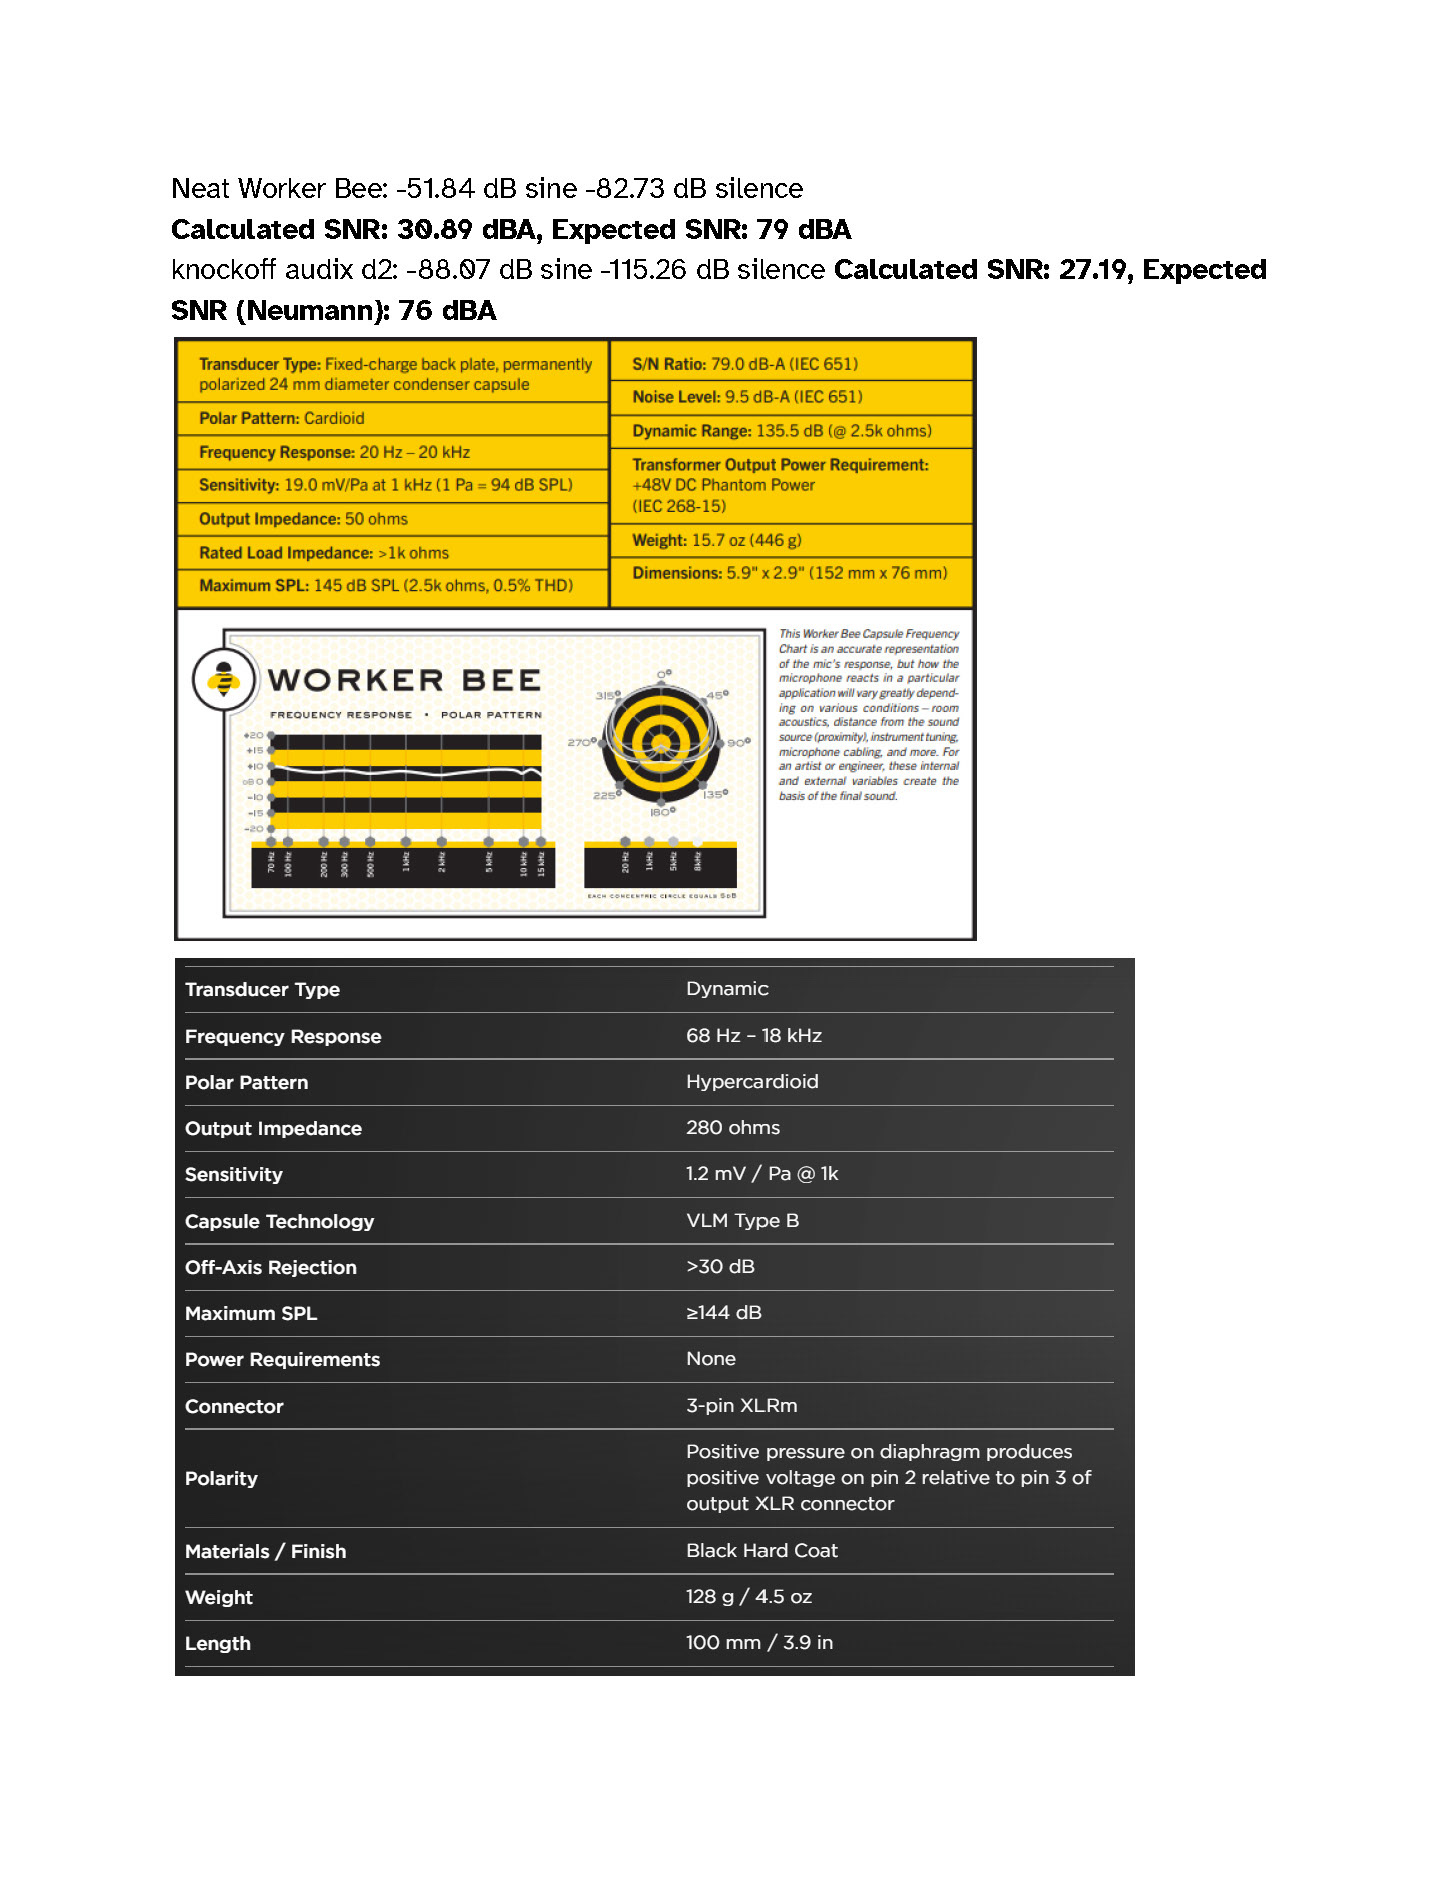
2. SNR calculation of dynamic microphone and expected SNR from manufacturer
3. SNR calculation of condenser microphone and expected SNR from manufacturer
4. Frequency Analysis Screenshots of
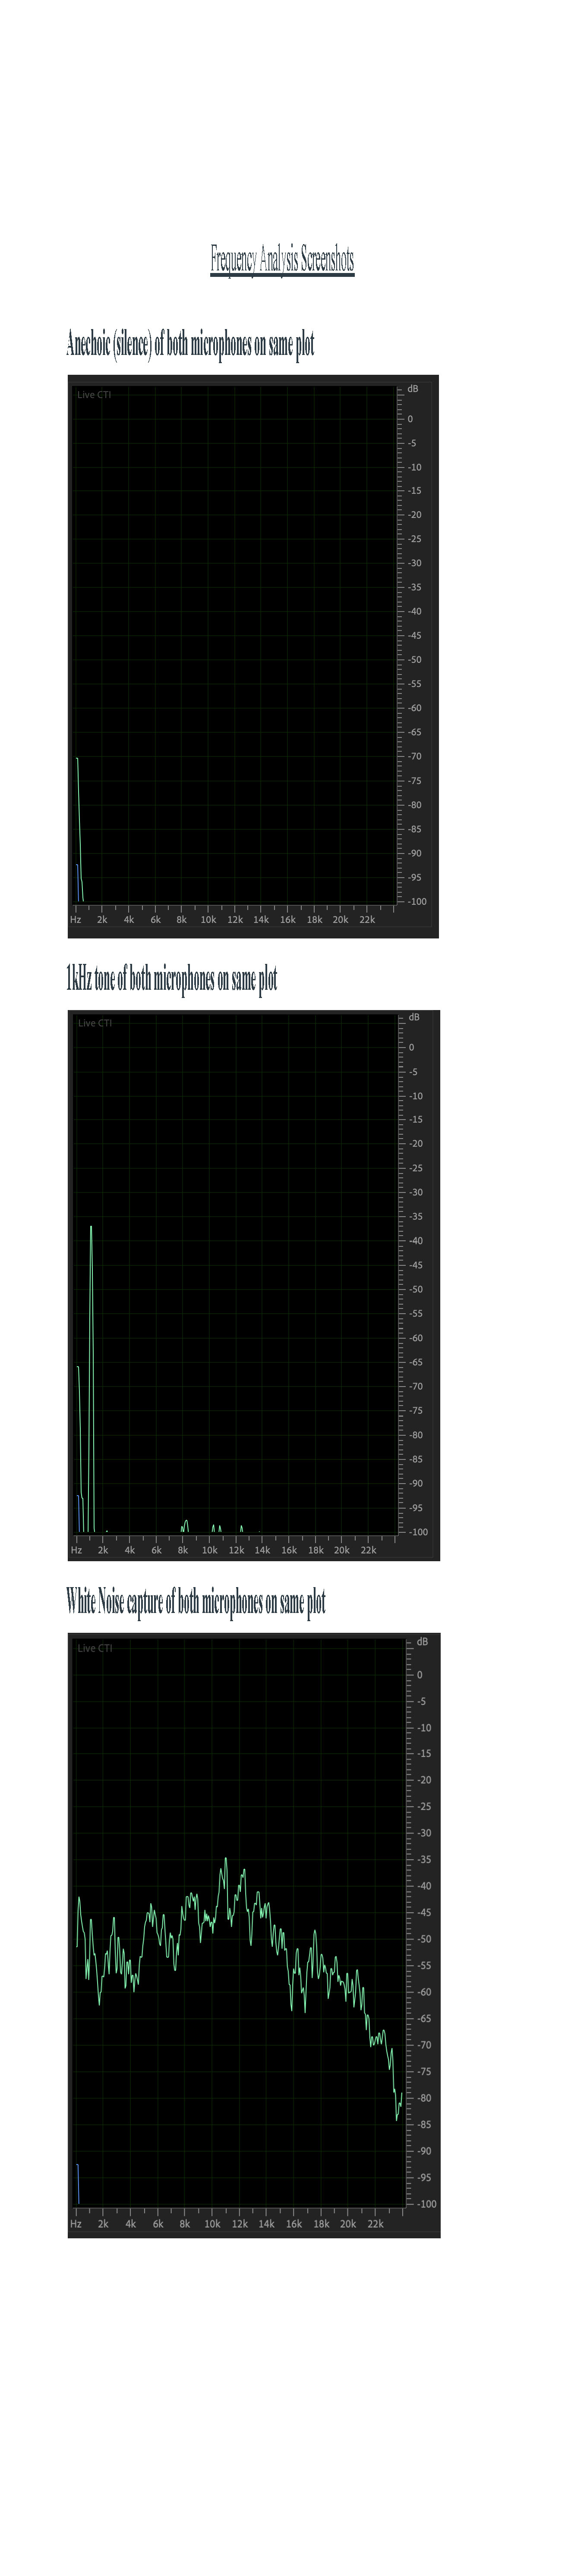
Anechoic (silence) of both microphones on same plot
1kHz tone of both microphones on same plot
(White) Noise capture of both microphones on same plot
5. Spectrum Screenshots of
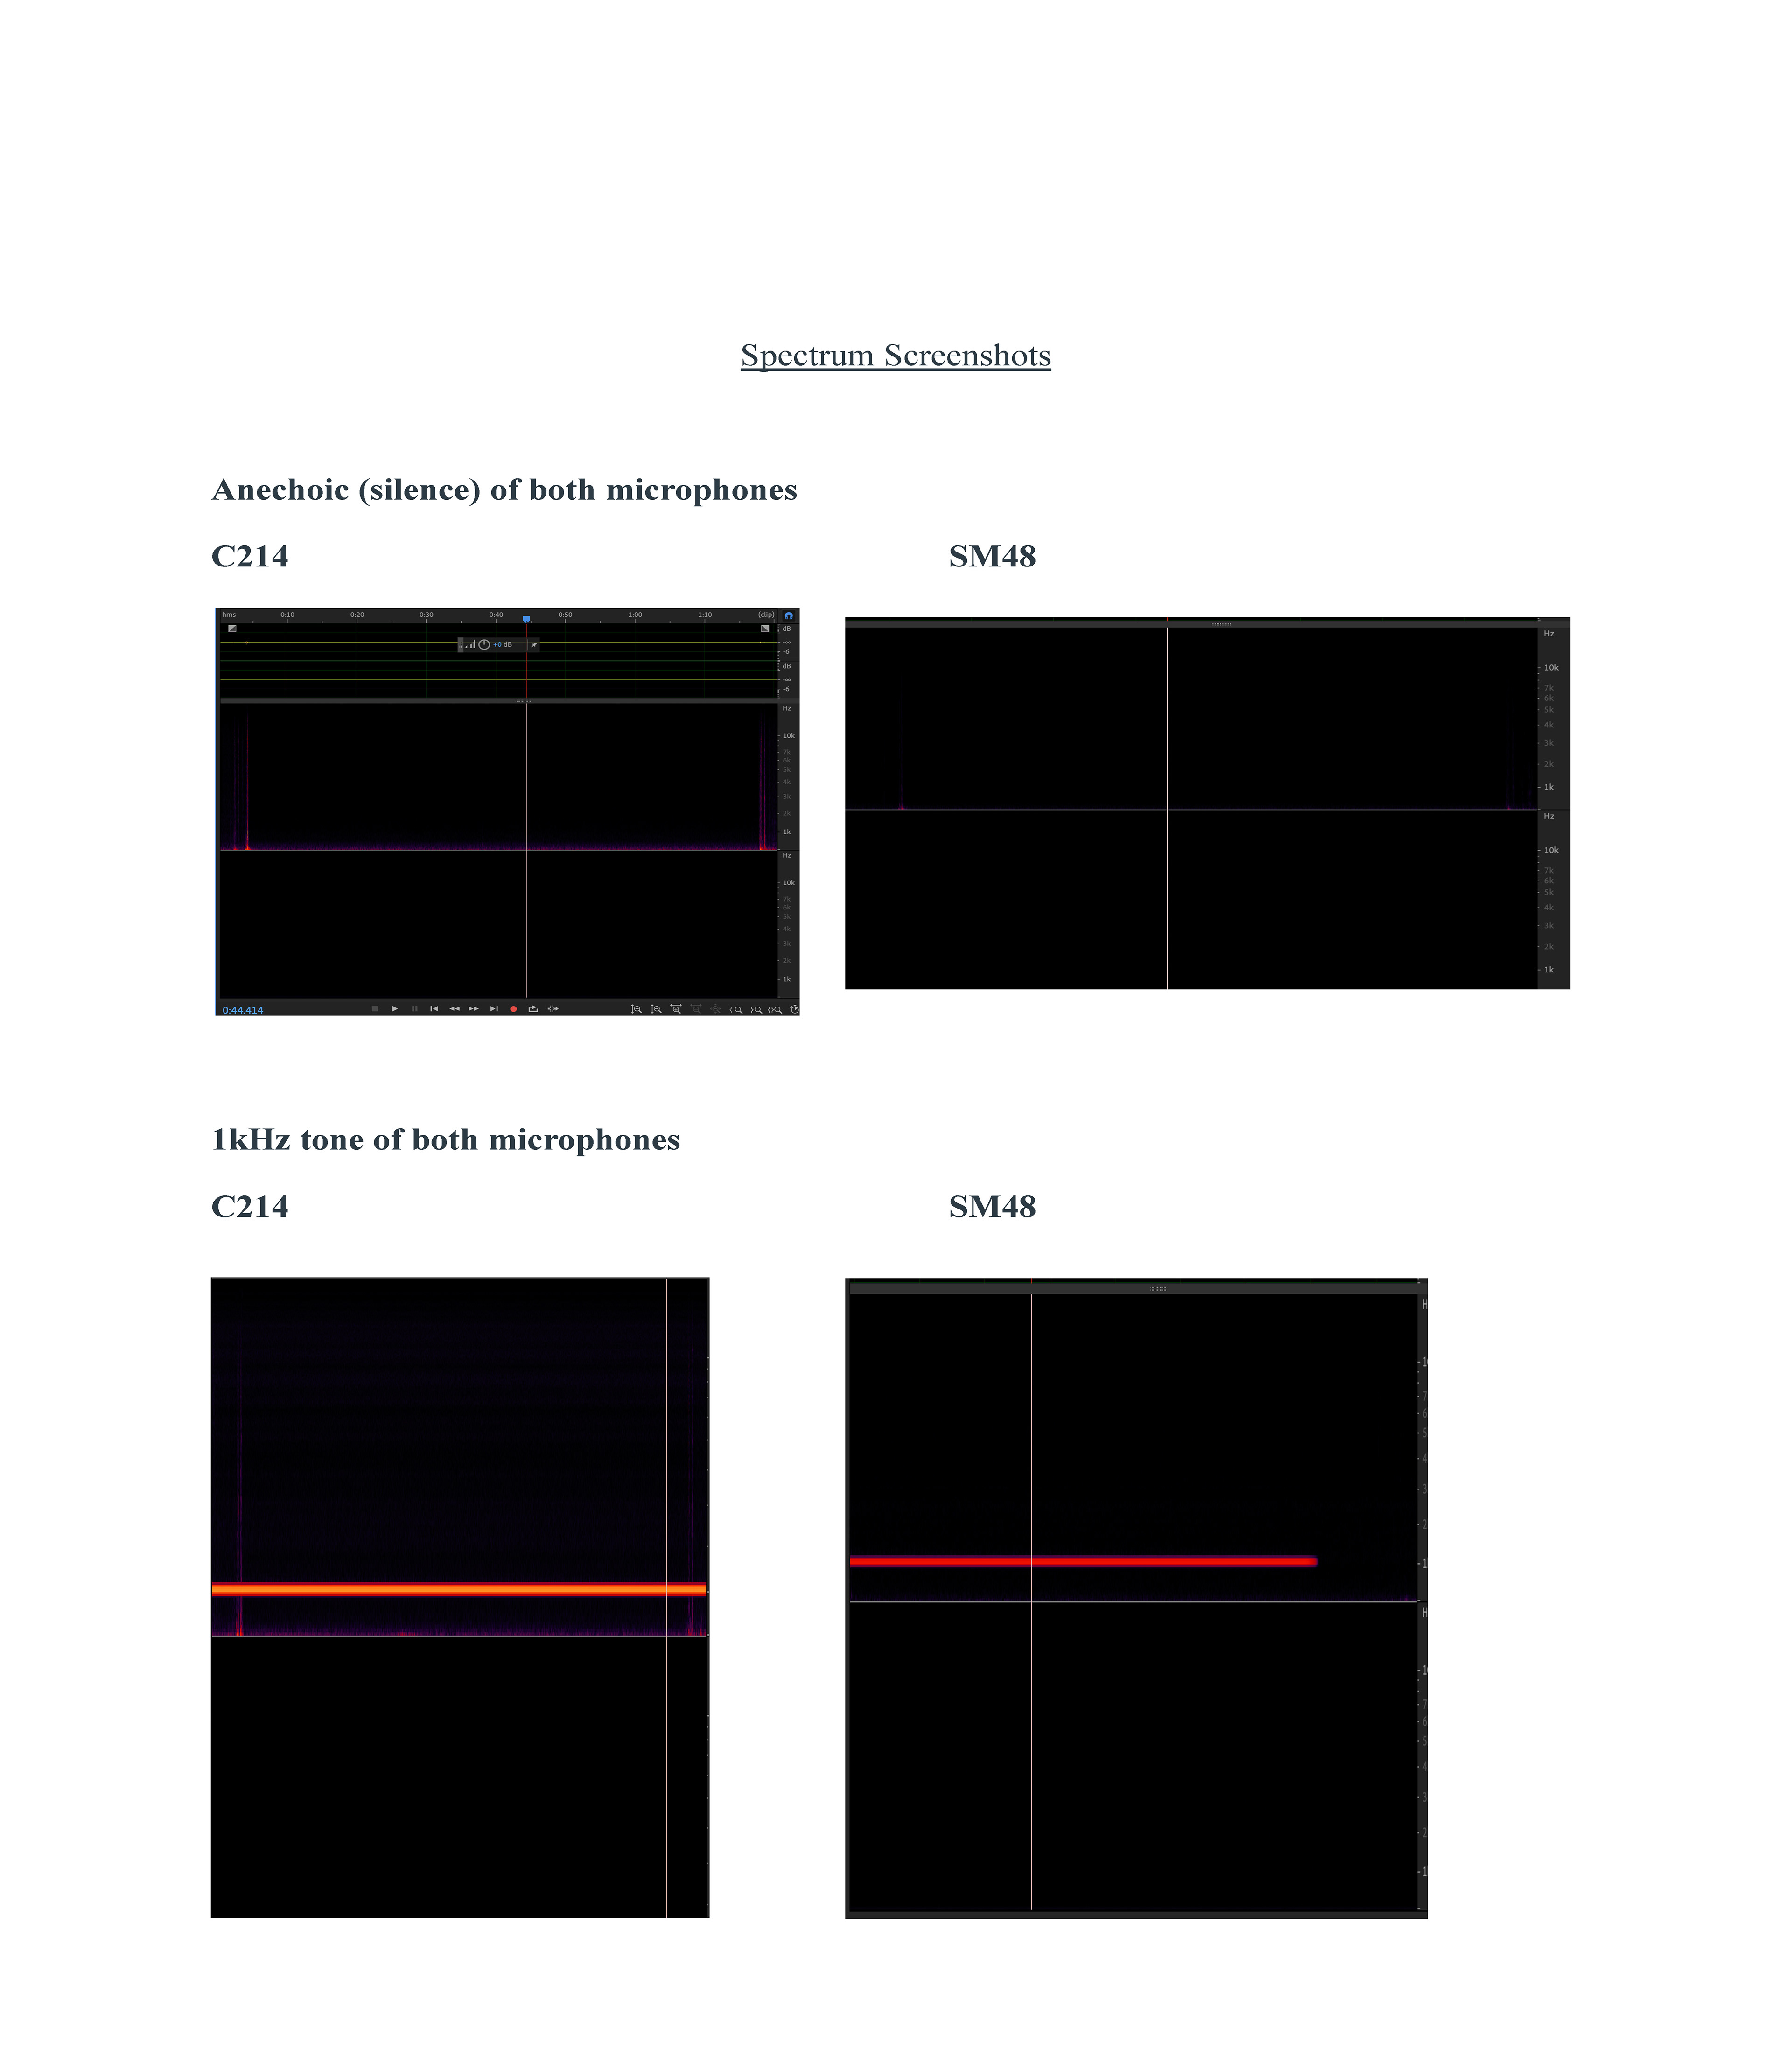
Anechoic (silence) of both microphones
1kHz tone of both microphones
Noise capture of both microphones
6. A paragraph on SNR. Does the measured SNR match the SNR spec (specified by the manufacturer)? Ifnot, what could be causing the differences?
7. Description of the timbre differences of the two microphones. Hint, compare and contrast the frequency analysis and spectrum of the (White) Noise recordings.
Resources
Adobe Audition How To Record and edit audio: https://helpx.adobe.com/audition/how-to/music-editor.html
Podcasting: https://spark.adobe.com/page/8vhIjhfHyP2F7/ (https://helpx.adobe.com/audition/how-to/music-editor.html)
(https://spark.adobe.com/page/8vhIjhfHyP2F7/)
Student Example #1


Student Example #2

Isaac Munoz is a full time staff engineer at Qualcomm Technologies International and a lecturer in the School of Music and Dance. Munoz teaches audio recording and sound reinforcement.